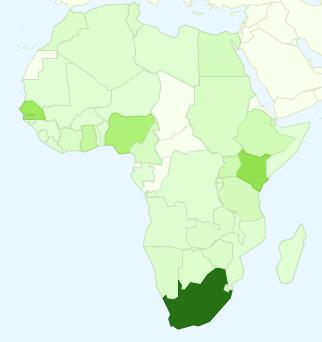
Savvy browser, mobile, OS trends emerge from recent site visits
In November 2010, we reported on demographics of visitors to this site. Now, 8 months later and with a larger sample size, it is time to examine how African web habits have changed. A less-than-scientific look at internal web traffic to this site confirms many national, regional, and continental trends. Did you know West Africa seems to have a strong affinity for Firefox or that East Africa may be more likely than other African regions to use Chrome?
- 28% of visits came from Africa – up 3%
- 38% of African visits come from the cities of Nairobi, Dakar, Kampala, Accra, and Lagos – up 5%
- Share of visits by region – identical
- 33% of African visits are from South Africa (up 6%), followed by 13% from Kenya (down 4%), and 12% from Senegal (up 6%)
- Still no visitors from Equatorial Guinea, Chad, or Central African Republic
The caveat: the content on this site tends to appeal to a more academic than traditional African audience. Accordingly, the trends for African visits will not necessarily represent the “typical” African web user.
Mobile:
- Most African iPhone/iPad visits were from South Africa. Kenya ranked #2. No surprises here given the tech climates in both nations.
- The highest number of Android visits were from Kenya. This supports the popularity of the platform in East Africa.
- Somewhat surprisingly, there was one iPad visit each from Ethiopia, Djibouti, and Mali. I would love to identify and interview these three individuals!
Operating System:
African-based visits are still extremely likely to come from computers running Windows. However, the share of visits that came from Macintosh OS have increased substantially. Also, positively, the proportion of other operating systems (iPad, mobile) has increased as technology penetrated African markets and became more affordable.
| Operating System | Past 8mo | Prev. 12mo |
| Windows | 79.7% | 84.4% |
| Macintosh | 13.7% | 9.5% |
| Linux | 3.0% | 5.2% |
| Other | 3.6% | 1.0% |
More interesting are trends by region:
- North Africa and West Africa are most likely to use Windows.
- Southern Africa (namely South Africa) has a relatively high share of Macintosh users (more than double other African regions).
- Eastern Africa, has double the share of Mac users compared with Western, Middle, or North Africa, suggesting the region has a relatively advanced tech environment. High shares of Linux and Other OS users support such a notion.
- Linux has a 10% share among visits from Middle Africa (mainly Cameroon, in this case). Either tech knowledge is high, or the same handful of individuals is making repeat visits and skewing the number.
Browser:
Africans tend to be more progressive that the international norm in terms of browser use. Firefox is, by far, the most popular browser. And, Chrome is not far behind Internet Explorer in terms of usage. Impressive is the shift from IE to Chrome or Safari.
| Browser | Past 8mo |
Prev. 12mo |
| Firefox | 44% | 48% |
| IE | 25% | 31% |
| Chrome | 19% | 15% |
| Safari | 8% | 5% |
| Opera | 2% | 1% |
Again, trends by region are fascinating:
- Nearly two-thirds of West African visits came via Firefox – well above the global mean for this browser.
- Conversely, only 25% of Southern Africans used Firefox when visiting this site. Instead, among Southern Africans, the browser share was more spread-out (partially due to Safari use on Macintosh computers).
- Eastern Africa leads the regions in terms of Chrome use.
- The absolute lack of ‘other’ browsers in Middle Africa reiterates the absence of mobile broadband.
Language:
Despite the greater share of visits from Senegal, the share of French-language visits has decreased:
| Browser Language | Past 8mo |
Prev. 12mo |
| English | 92% | 88% |
| French | 7% | 11% |
| Other | 1% | 1% |
Java:
Despite the prevalence of non-IE & non-Android browsers, Java was only enabled 70% of the time:
| Java-enabled | Past 8mo |
Prev. 12mo |
| Yes | 69% | 79% |
| No | 31% | 21% |
Source: Google Analytics, July, 2011. Regions as defined by Google Analytics.


 Twitter
 Facebook
 Pinterest