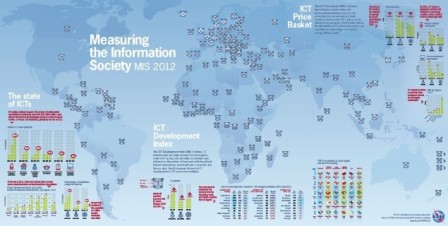
Notes from ITU’s ‘Measuring the Information Society 2012’
The International Telecommunications Union (ITU), regarded as a prime source for Internet statistics, has released a detailed report on Internet usage habits in 155 countries around the world. Similar to previous years, Measuring the Information Society 2012 serves to gauge how developed and developing nations compare in terms of overall information communication technology adoption. Of interest to many is the ICT Development Index which ranks nations by number of subscriptions, type of subscription, broadband availability, cost of access, and level of education. This ranking only goes so far, however, and the value of comparing African ICT benchmarks with global stats is marginal since nearly all African nations lag developed counterparts in terms of ICT access, ICT use, and ICT prices.
Stepping away from the ICT Development Index (IDI), key themes found in developing nations include the falling costs of broadband (often double-digit) and the rapid mobile sector growth. Still, the ‘digital divide’ (a term we don’t like to use) remains significant. Mobile broadband is still not in a position to replicate the successful growth of mobile-cellular subscriptions. Prices must go down even further.
In developing countries, mobile broadband services have experienced 78% annual growth. Fixed broadband prices have dropped by 75% in developing countries between 2008 and 2011. Still, as of 2011, mobile broadband in Africa costs 64% of gross national income per capita.
Below are some of the granular findings from the report that best describe how African nations are utilizing the Internet.
- The 13 lowest ranking nations are all located in Africa. 22 of 25 lowest in terms of IDI are African.
- Within Africa, Seychelles has the highest IDI (70), closely followed by Mauritius (74). At the bottom internationally are Niger (155), Chad (154), and Central African Republic (153).
- Countries making the most overall ICT development progress include Ghana, Kenya, Rwanda, and Zimbabwe.
- Ghana: Strong growth in the use of ICT. Mobile broadband penetration grew from 7% in 2010 to 23% in 2011 and ranks the highest of any African country. Mobile broadband prices are 14% of GNI thanks to 3G competition from five operators. Also, 14% of Ghanaians are Internet users.
- Kenya: The number of Internet users doubled from 2010 to 2011 (from 14% to 28%). Broadband penetration is still below 1%, however, suggesting subscription sharing or 2/2.5G reliance.
- Rwanda: The only “least developed country” to improve the most in ICT development index ranking. Internet bandwidth per Internet user doubled from 2010 to 2011. Mobile broadband penetration jumped from 1% to 6% in the same period.
- Zimbabwe: Mobile broadband penetration almost tripled from 2010 to 2011 and is now at 15%. International bandwidth has increased following the landing of EASSy.
- Mauritania made relatively strong improvements in ICT access.
- Niger is the only country where the IDI value decreased. As a result, Niger ranks below Chad this year.
- Republic of the Congo fell the most relative to other nations in the index. 3G was recently launched and should soon increase Internet use.
- Household Internet access remains below 2% in at least one-third of African nations.
- Fixed broadband penetration was lower than 1% in 15 of 36 surveyed African nations as of 2011.
- Of African Arab nations, only Algeria, Djibouti, and Comoros had not launched 3G by 2011.
- Nigeria‘s fixed broadband price rank improved in 2011 after the service improved to unlimited access at 8 Mbit/s.
- In Cape Verde, fixed broadband prices decreased by 63% despite increased speed and data cap. The reason? International bandwidth and a 40% increase in subscriptions.
- Zimbabwe and Ethiopia saw greater than 90% reductions in fixed broadband between 2010 and 2011. Madagascar and Comoros also saw substantial decreases.
- Fixed broadband prices did not drop much in Togo or Niger between 2010 and 2011.
- Overall African ICT Price Basket decreased by 6.6% after falling by over 10% in each of the prior two years.
- Madagascar has the highest ICT price basket (2011) at 65% GNI. Niger is close behand at 64% GNI. In comparison, Egypt‘s price basket for 2011 is only 3% GNI.
- In Mauritius, Seychelles, Botswana, and South Africa, the ICT Price Basket is below 5% average monthly GNI per capita.
- In 10 of 31 African countries (ie. Swaziland, Eritrea, Togo, Rwanda) the ICT Price Basket exceeds average monthly GNI per capita.
- The ACE cable is expected to drive down high prices in Gambia and Sao Tome and Principe, but bandwidth shortages are likely to hinder price drops in Eritrea, Niger, and Swaziland.
- Tanzania‘s international bandwidth has increased from 300 Mbit/s in 2008 to 5,000 Mbit/s in 2011.
- In Mauritius, Namibia, Seychelles and South Africa 1 GB of postpaid mobile-broadband services costs 10% or less of GNI per capita, but corresponds to more than 200% of GNI per capita in Zimbabwe and 600% in Liberia.
- Four African countries only offer prepaid computer-based mobile broadband access.
- South Africa is the 16th largest telecom market in terms of revenue from telecom services (2010).
Interested in last year’s MIS report? Our summary can be found here.


 Twitter
 Facebook
 Pinterest